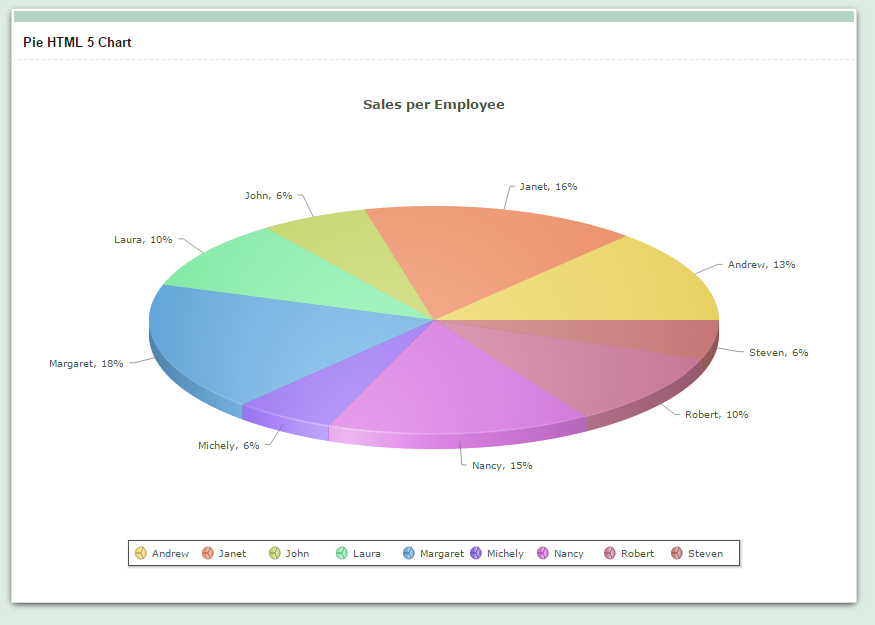
In this example we will see how to create a Pie chart using the Grid application.
Creating the Grid application
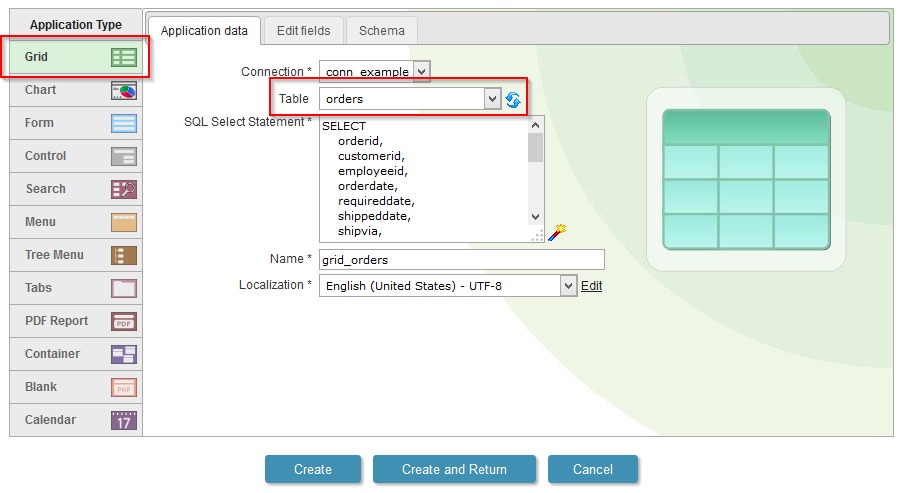
1. We will create a new Grid application based on the orders table.
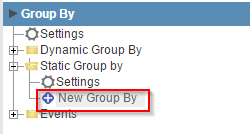
2. To enable the Chart in a Grid, we must create first of all a Group By in the application. Then go to the tab “Group by” in the application menu, then click on “Static Group by>> New Group by”.
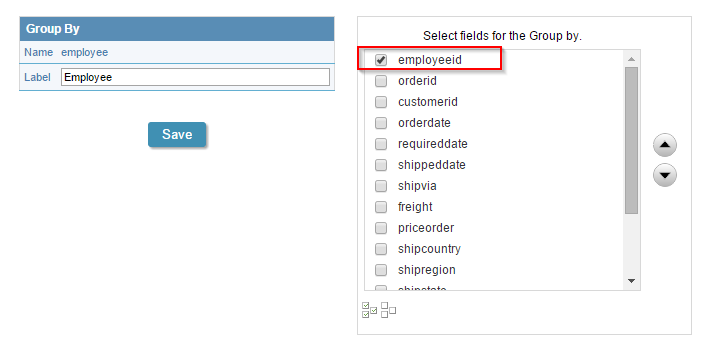
3. Select the field: “employeeid”.
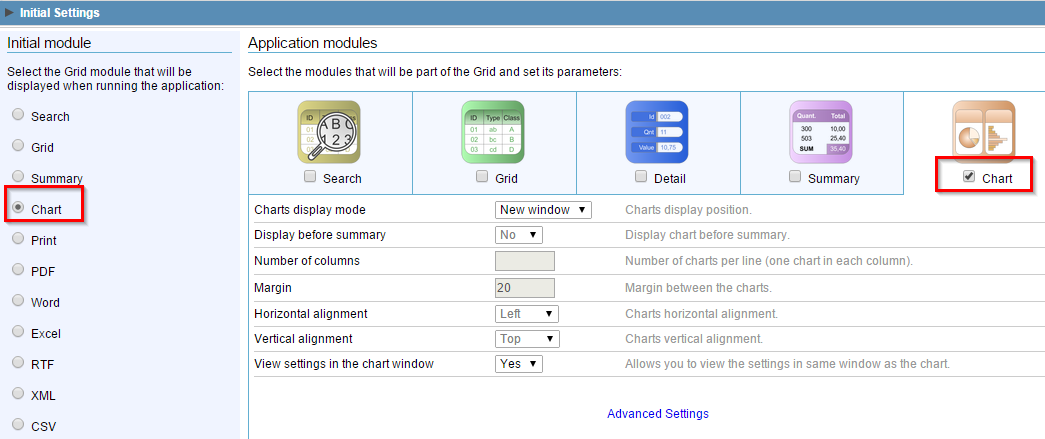
4. Back to the initial options “Grid Modules”
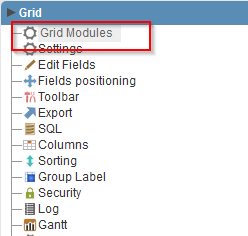
5. Mark the “Chart” as the initial module and enable just it.
6. Access the guide “Summary” in the application menu, then click on “Charts>>Settings”.
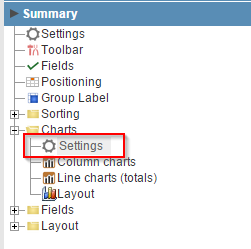
7. Select the chart of “Pie” and change the other settings according to the image.
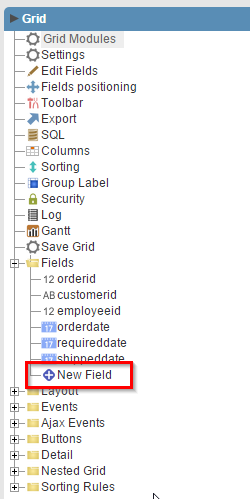
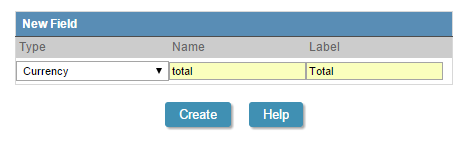
8. Go to “Fields >> New Field” option in the application menu
9. Create a field of type “currency” named “total”.
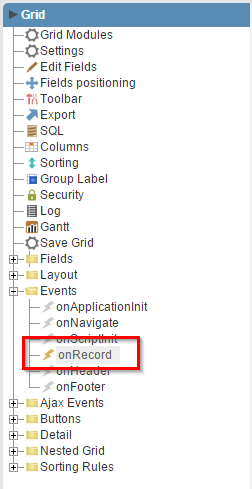
10. Go to the “Events >> onRecord” option in the application menu.
11. Use the following code in the event.
{total} = {freight} + {priceorder};
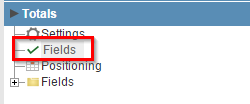
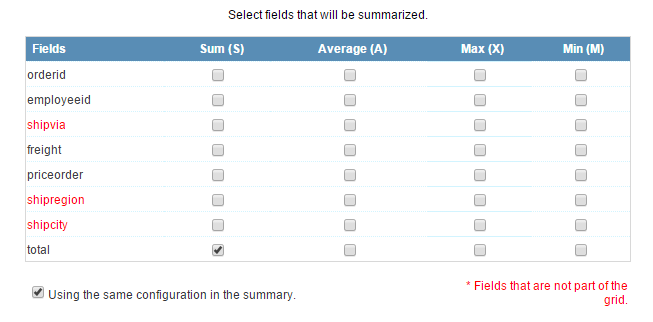
12. Go to the “Totals” tab in the application menu, then click on “Fields”.
13. Check only the column “Sum” in the field “total” so that the sum of the values of this field is created.
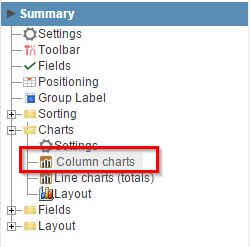
14. Now go to the “Summary” tab in the application menu, then click on “Charts >> Columns Charts”.
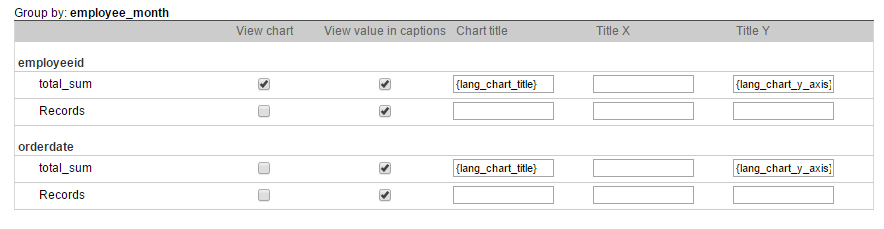
15. Check to display only the chart “total_sum” field “empoyeeid,” according to the image.
16. Click on the button “Run application”

Comment this post