This example will use a menu treeview application to display the new charts generated by Scriptcase.
![](http://scriptcase.net/scriptcase-samples/tutoriais/grid/img/menu_charts.png)
Creating Chart applications
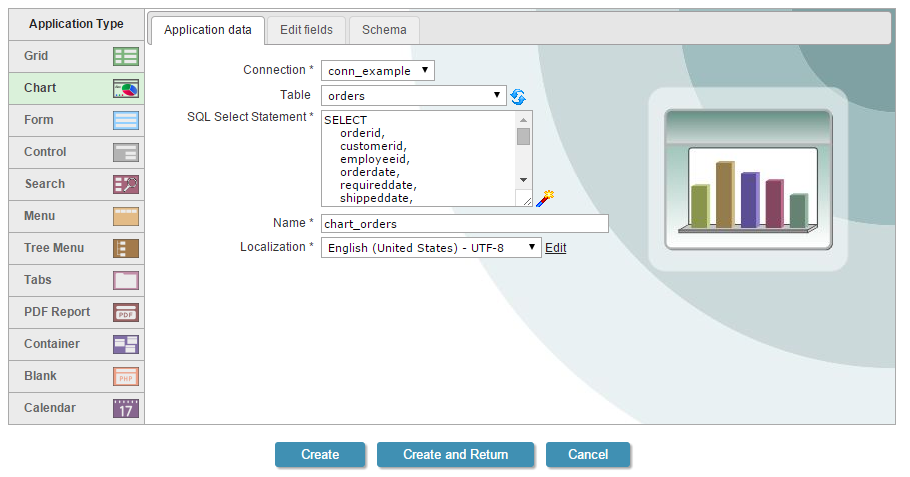
1. The chart applications will be based on the orders table.
![](http://scriptcase.net/scriptcase-samples/tutoriais/grid/img/newapp_chart_orders.png)
2. Access the “Charts” option in the application menu.
![](http://scriptcase.net/scriptcase-samples/tutoriais/grid/img/chart_menu_inicial.png)
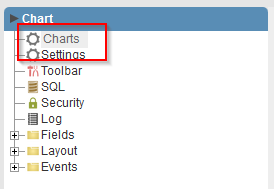
3. In “Dimensions” we will select the field “employeeId”.
![](http://scriptcase.net/scriptcase-samples/tutoriais/grid/img/menu_charts_1.png)
4. In “Measure” we will select “Record Count” and the sum of the field “PriceOrder”.
![](http://scriptcase.net/scriptcase-samples/tutoriais/grid/img/menu_charts_2.png)
5. In “Chart”, we must select the type of chart we want.
![](http://scriptcase.net/scriptcase-samples/tutoriais/grid/img/menu_charts_3.png)
6. Click “Run application” to generate the source code and view the application.
![](http://scriptcase.net/scriptcase-samples/tutoriais/grid/img/run.png)
Note 1: For the combination chart, we must check the option “Initial value” to the 2 selected metrics.
![](http://scriptcase.net/scriptcase-samples/tutoriais/grid/img/menu_charts_4.png)
Note 2: For the Stacking chart, we should also add the field “Freight” in the metrics.
![](http://scriptcase.net/scriptcase-samples/tutoriais/grid/img/menu_charts_5.png)
Creating a Menu
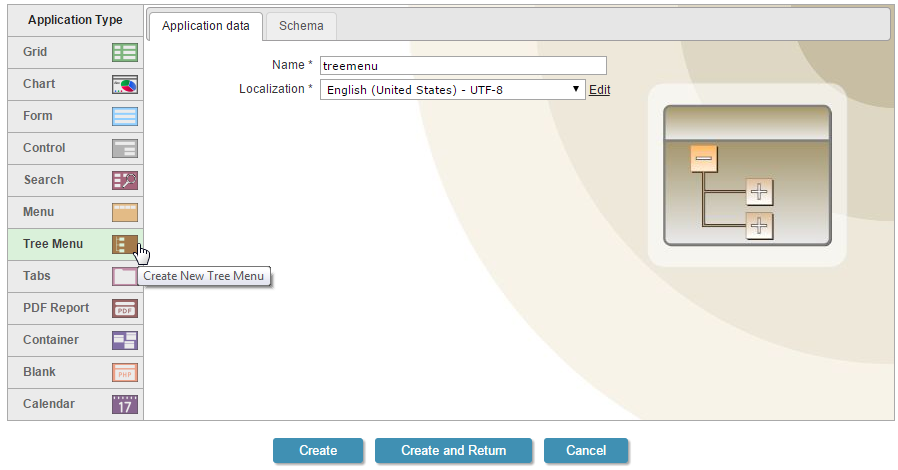
7. Create a new application type Tree Menu.
![](http://scriptcase.net/scriptcase-samples/tutoriais/menu/img/img10.png)
8. To create the items that will be part of the menu, click on Menu Items and add the chart applications created previously.
![](http://scriptcase.net/scriptcase-samples/tutoriais/menu/img/img02.png)
9. Click “Run application”
![](http://scriptcase.net/scriptcase-samples/tutoriais/grid/img/run.png)
Comment this post