In this example we will use 3 applications, 2 Gauge Charts and 1 Container to display the charts simultaneously, as in a dashboard.
Creating applications Graphics
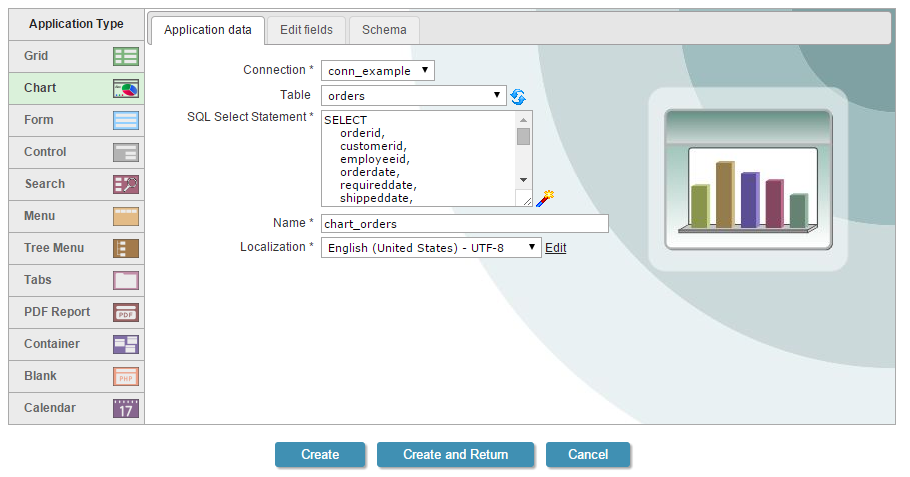
1. Create a new application of Chart based on the table orders but add in the SQL, the clause: WHERE orderdate BETWEEN ‘2008-01-01’ AND ‘2008-06-30’.
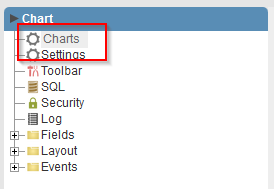
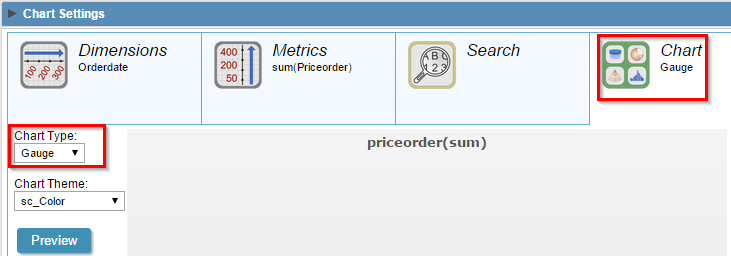
2. Open the option “Charts” in the application menu.
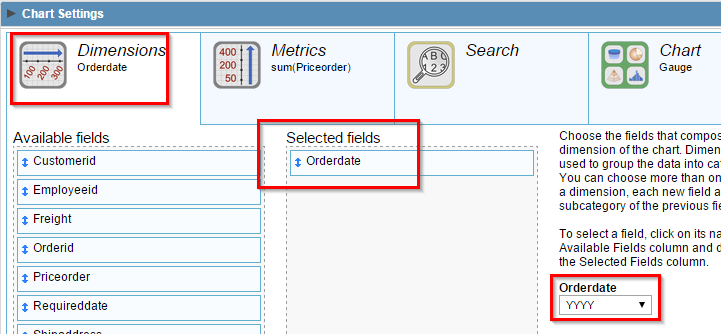
3. In “Dimensions” we will select the field “orderdate” in the Year format.
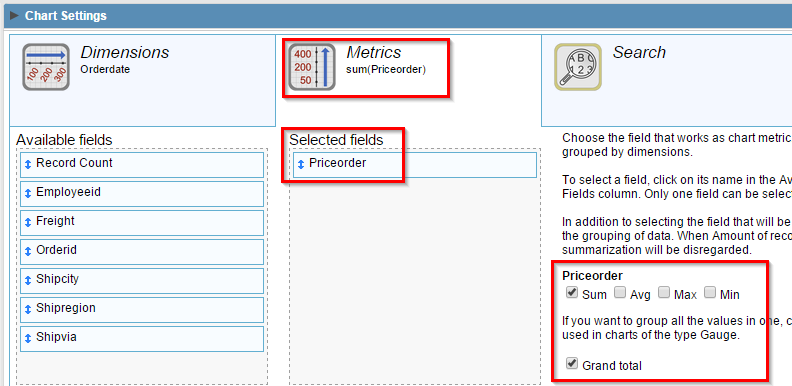
4. In “Metrics” we will select the field “PriceOrder” with the “Grand Total” option.
5. In “Chart”, we will select the type “Gauge” and shape “Circular”.
6. Click on “Run application” to generate the data source and view the application.

7. TO create the second chart, we will be following the steps used to configure the previous application, just changing the WHERE Clause to get the second semester of 2008 ( WHERE orderdate BETWEEN ‘2008-07-01’ AND ‘2008-12-31’ ) and the shape “Semi-Circular”.
8. Generate the source code.
Creating the Container application
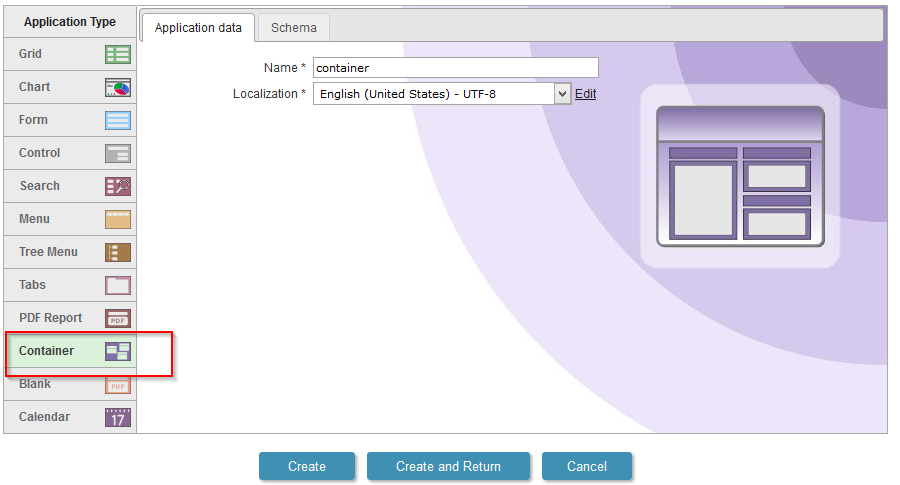
9. Create a new Container application
10. In the “Settings” menu of the application, click on the button to “Add Column”
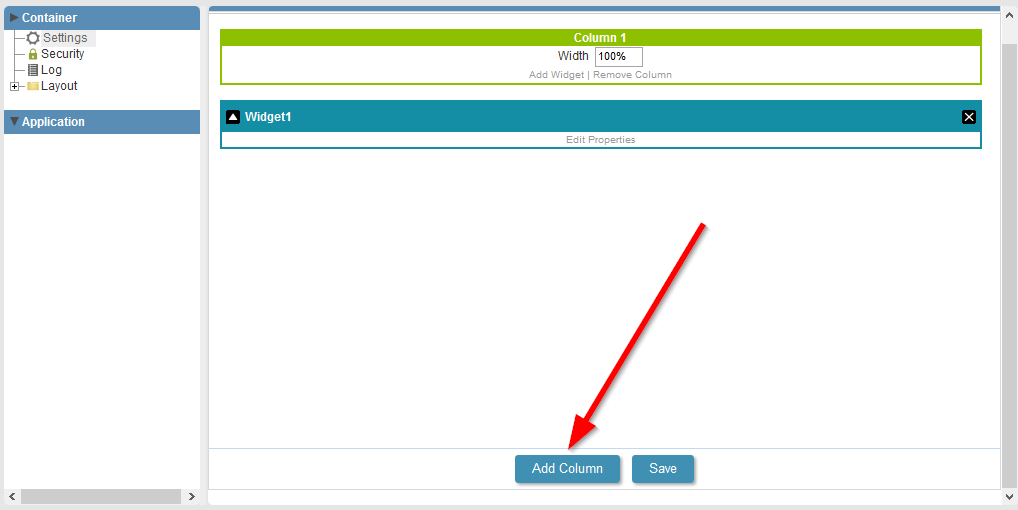
11. Use the widget settings according to the image below.
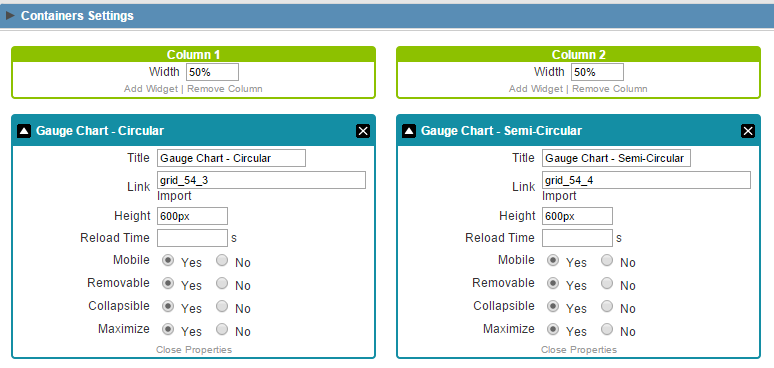
12. Click on “Run application” to generate the data source and view the application.
Comment this post