In this example we will use 5 applications, 4 Charts and 1 Container to display the charts simultaneously, as in a dashboard.
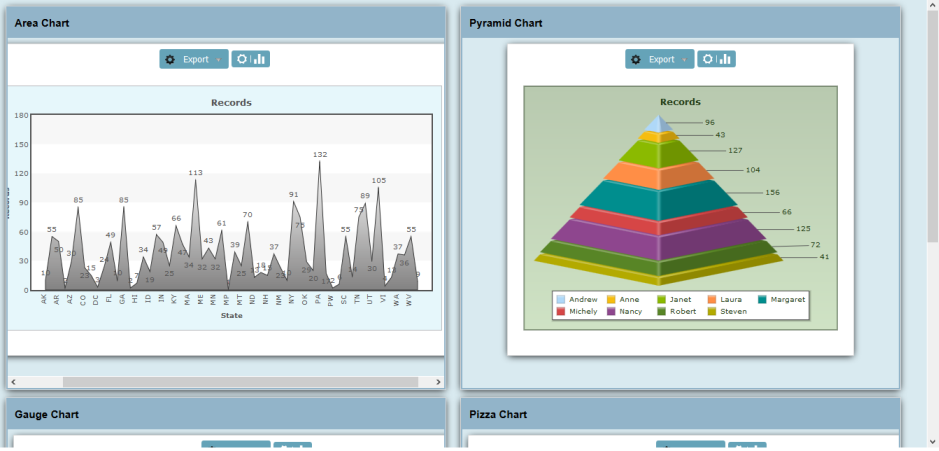
Here we can see each of the chart applications…
…and here the final application, a Container showing the 4 charts.
Creating applications Graphics
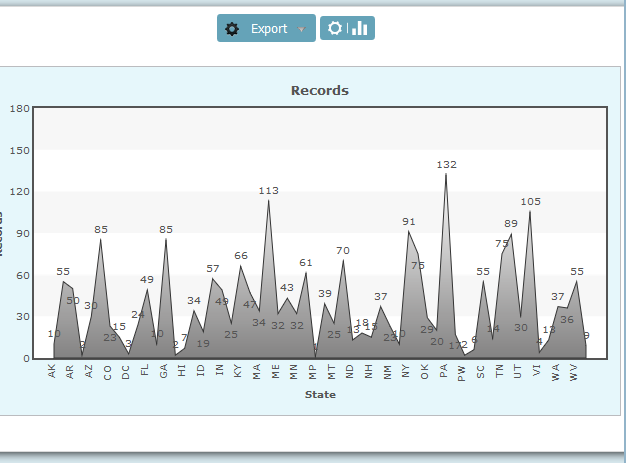
Area chart
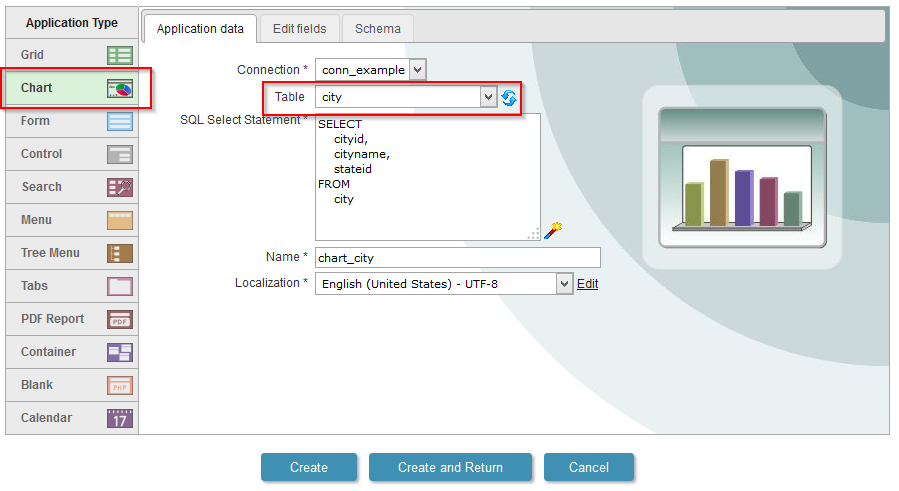
1. Create a new application of Chart based on the table city.
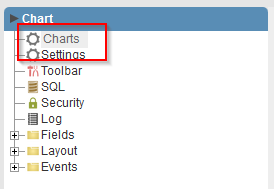
2. Open the option “Charts” in the application menu.
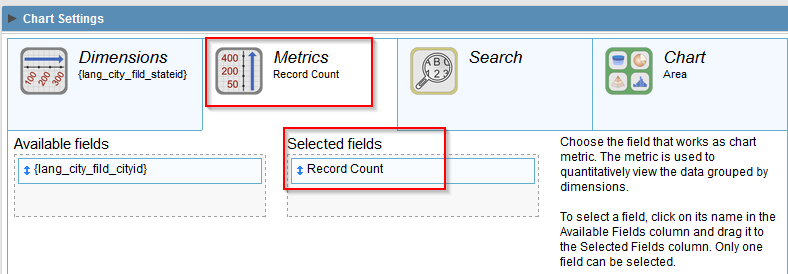
3. In “Dimensions” we will select the field “stateid”.
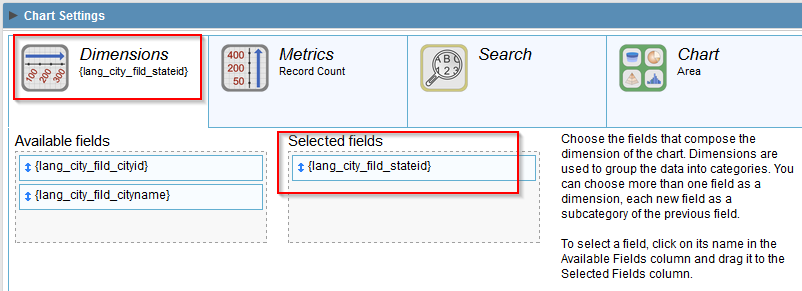
4. In “Metrics” we will select “Record Count”.
5. In “Chart”, we will select the type “Area”.
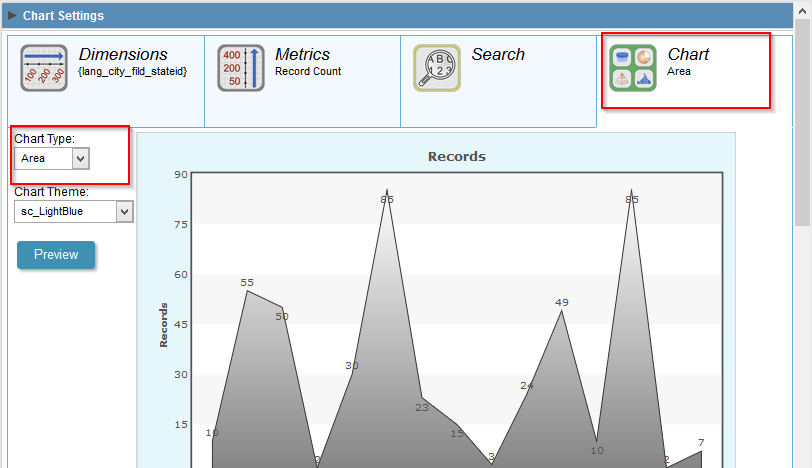
6. Click on “Run application” to generate the data source and view the application.

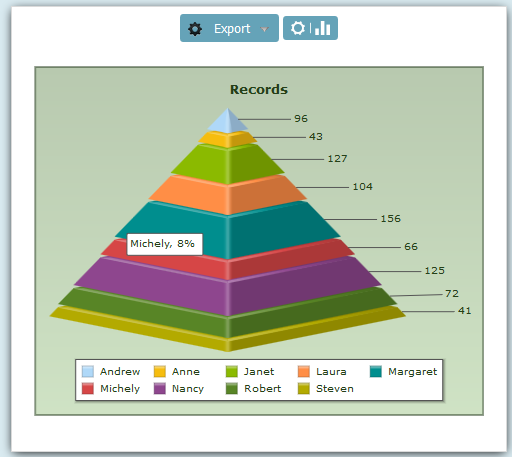
Pyramid Chart
- Following the steps used to configure the previous application, we should use the following settings for the pyramid chart:
- New application of Chart based on the table “orders”
- In the “Charts” menu, we will select the “employeeid” field as the “Dimensions”.
- The “Metric” will be the “Records Count”.
- And select the type “Pyramid” in “Chart”
- Run The application
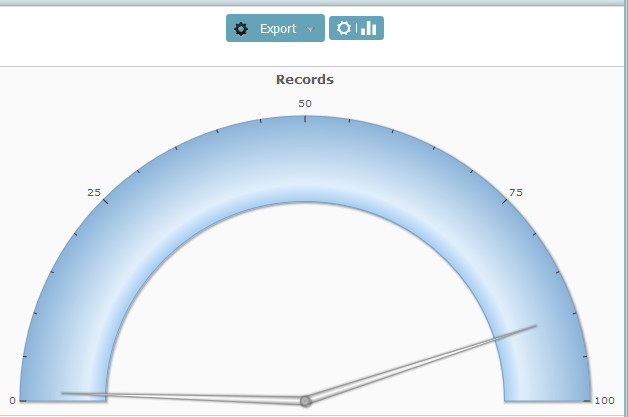
Gauge chart
- We will use the following settings for the Gauge chart:
- New application of Chart based on the table “customers”
- In the “Charts” menu, we will select the “cardtype” field as the “Dimensions”.
- The “Metric” will be the “Records Count”.
- And select the type “Gauge” in “Chart”
- Run The application
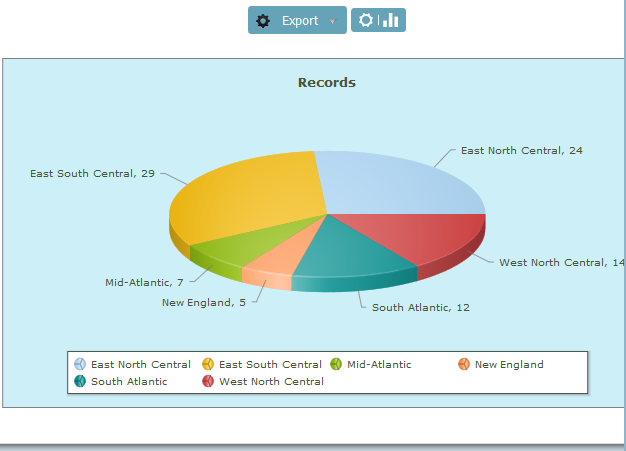
Gráfico de Pizza
- We will use the following settings for the Pizza chart:
- New application of Chart based on the table “customers”
- In the “Charts” menu, we will select the “regionid” field as the “Dimensions”.
- The “Metric” will be the “Records Count”.
- And select the type “Gauge” in “Pizza”
- Run The application
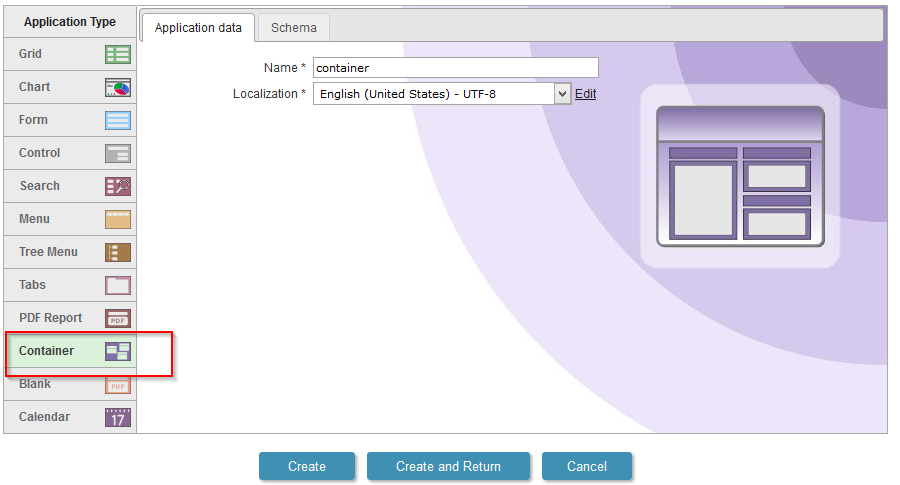
Creating the Container application
10. Create a new Container application
11. In the “Settings” menu of the application, click on the button to “Add Column”
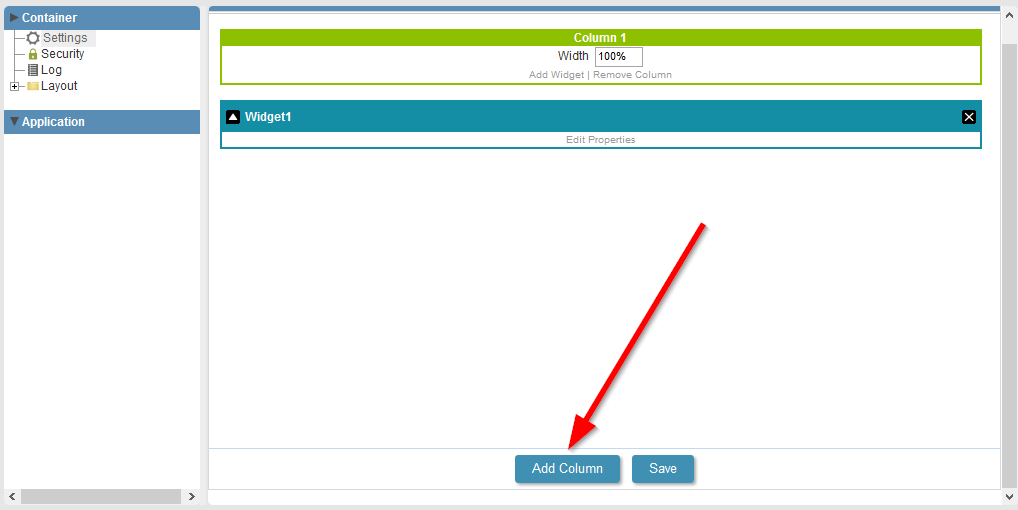
12. In each column, add another widget.
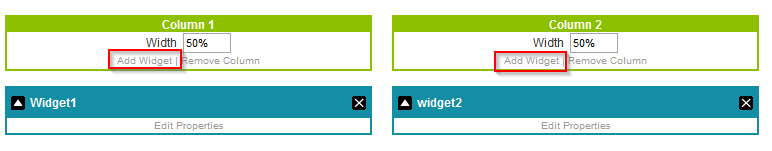
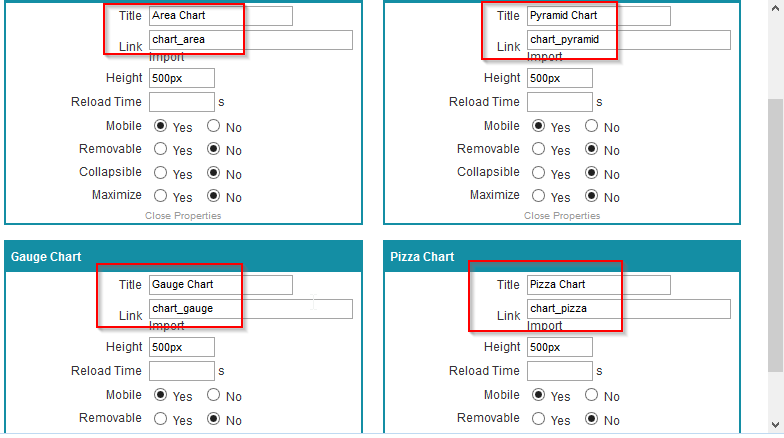
13. In each of the widgets we will use a 500px height and we will enable only the “Move” option. Set a title and link an application of chart for each widget. See the image below.
Comment this post