In this example an container application is created containing chart applications created earlier.
Creating a new Container
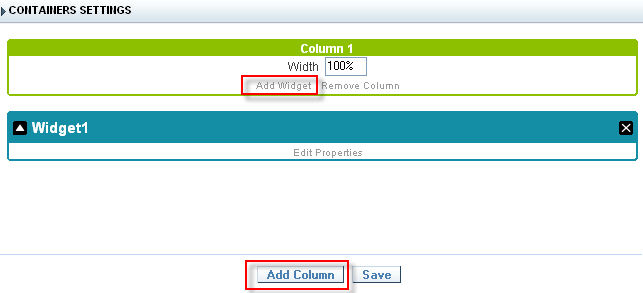
1. Create a new container application.
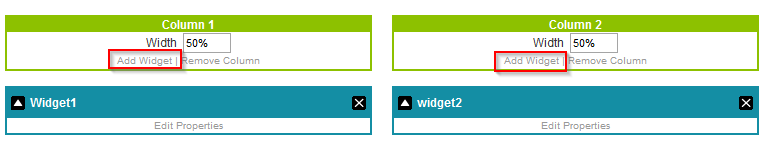
2. In the application menu open the Container >> Settings and click on Add Column.
3. Then add a widget for each column.
4. In the first widget, click the Edit Properties link to add an application to the container.
5. Set the container title, the link to the application sample_chart01 and click on Save.
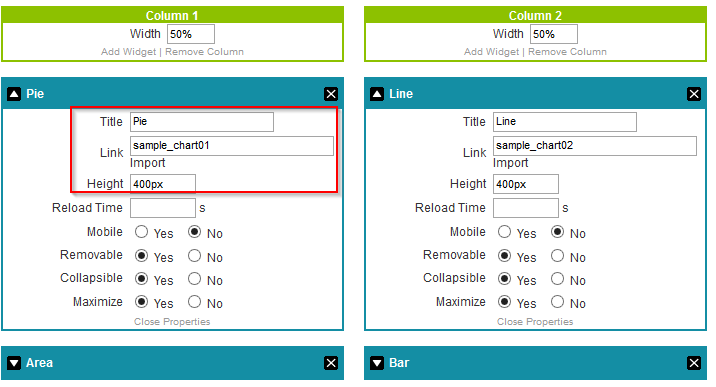
6. Repeat the previous step to create links with applications sample_chart02, sample_chart03 and sample_chart04.
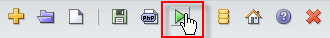
7. Click the Run button on the toolbar.
Comment this post