In this tutorial we will be seeing how you can send a graphic by means of an email.

Creating a Chart
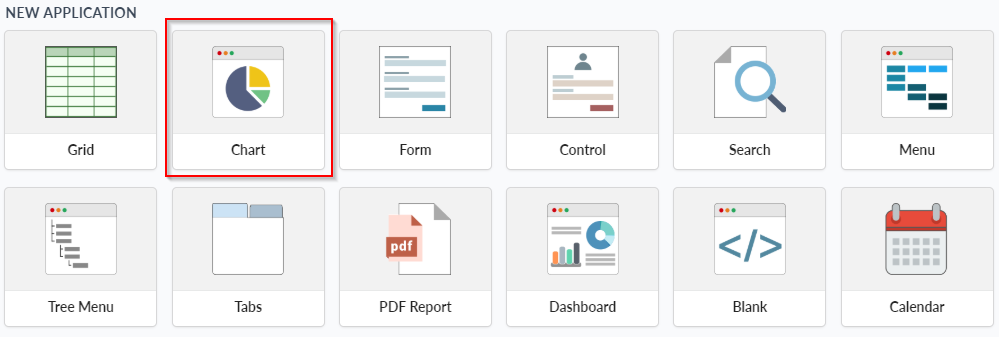
1- We must create an application of the Chart type
2. We use the example table “Orders“.

3. We put the Metrics and Dimensions.

4. We configure the type of Chart.

5. You can also configure the metric and dimension fields.

6. Once the chart is configured, we proceed to select the Export option.

7. In API we put Custom to configure with the data of our mail server to be able to send.

8. We add the option to export by email to the Toolbar.

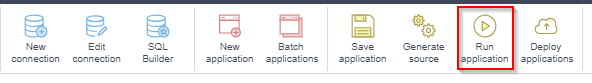
9. Finally, select the “Run application” button on the toolbar to generate the application.
To see more examples created with Scriptcase, go to: Examples: Complete systems and applications with Scriptcase
Comment this post