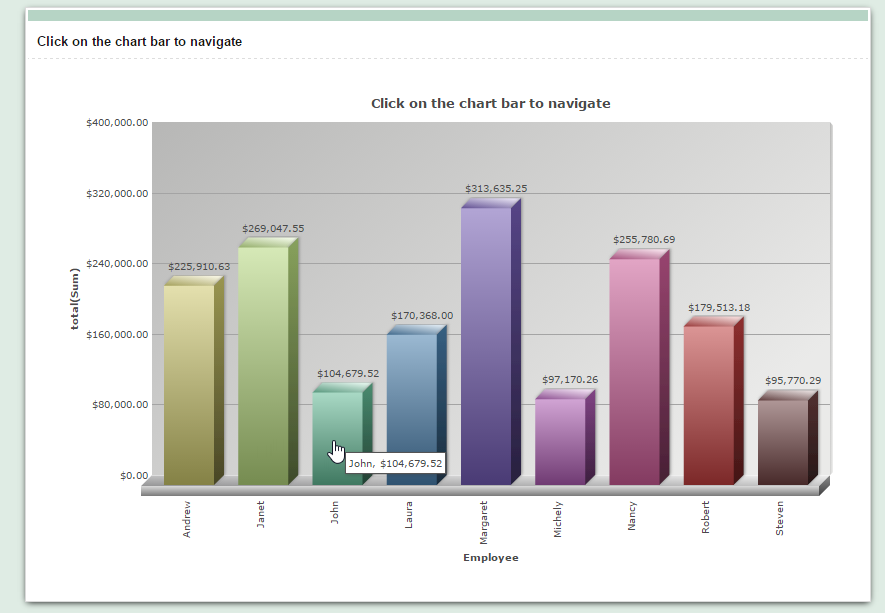
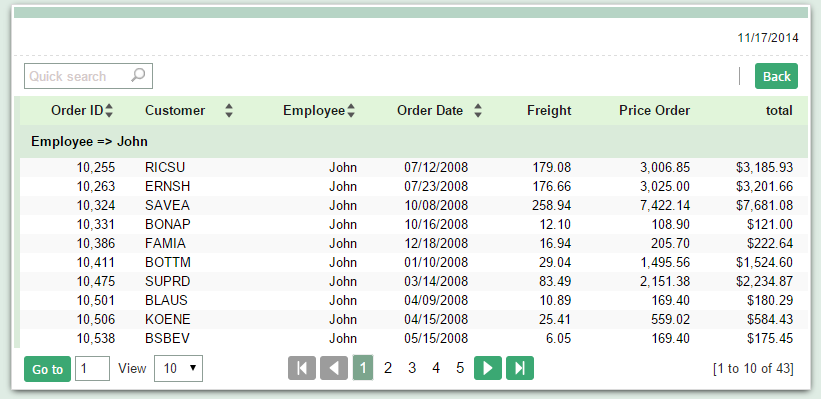
In this example we will see how to create and use a link between the Chart and the Grid, allowing the end user to navigate from a graph to display the details of a record.
Creating the Grid application
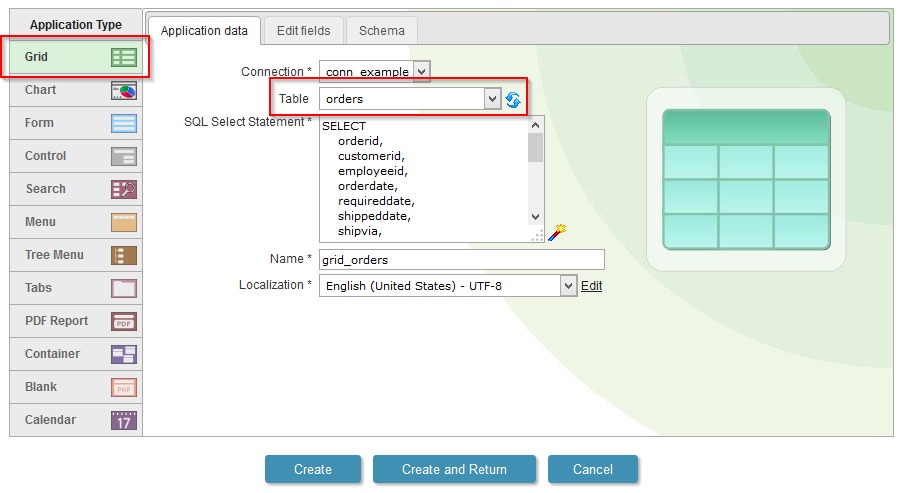
1. We will create a new Grid application based on the orders table.
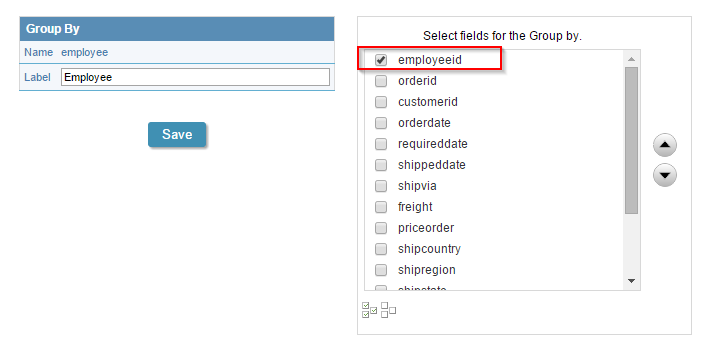
2. Open the guide “Group By” in the application menu, then click on “Static Group By>>New Group By”.
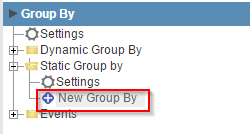
3. Select the field: “employeeid”.
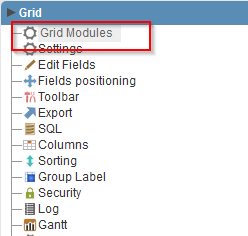
4. Back to the initial options “Grid Modules”
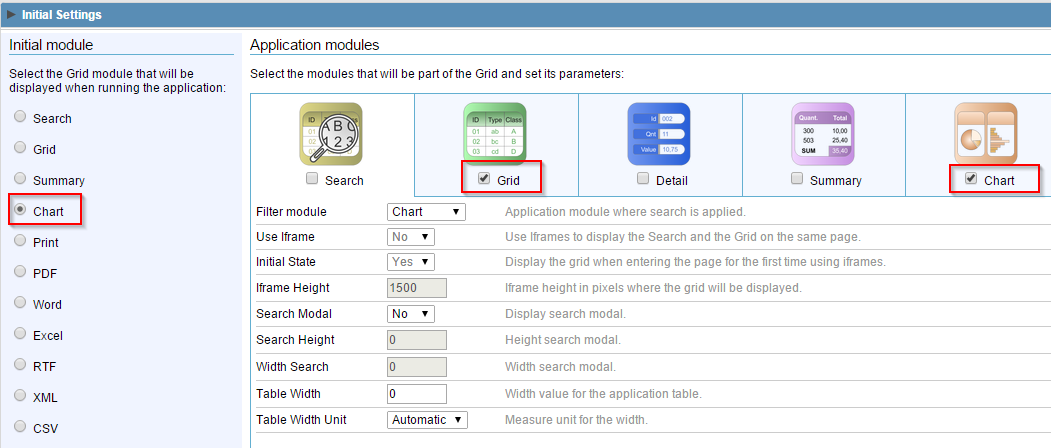
5. Mark the “Chart” as the initial module and enable just the modules: “Grid and”Chart“.
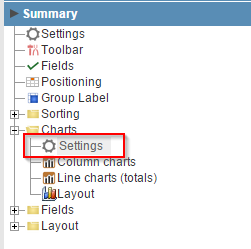
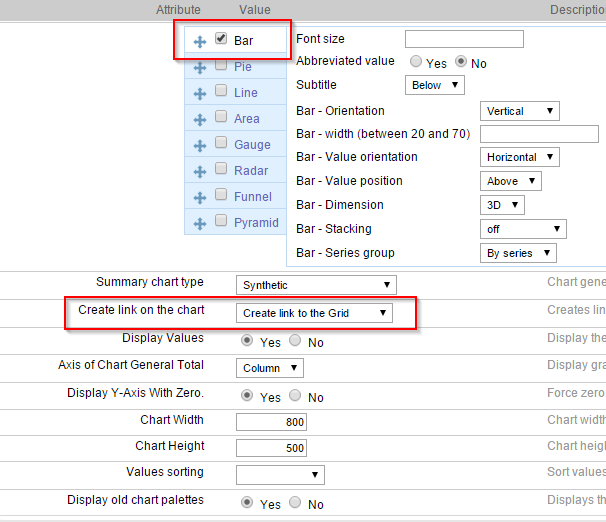
6. Access the guide “Summary” in the application menu, then click on “Charts>>Settings”.
7. In the “Create link on the chart”, change to “Link to Grid.” Use the other chart settings according to the image below, or the settings you prefer.
8. Click on the button “Run application”

Comment this post