Tutorial: Chart Stacked – Column

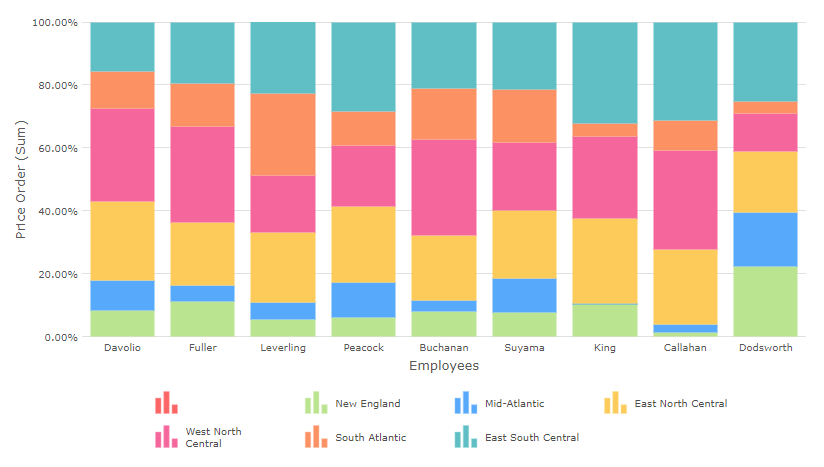
In this tutorial we will be looking at how to create a Chart of Stacked Columns.

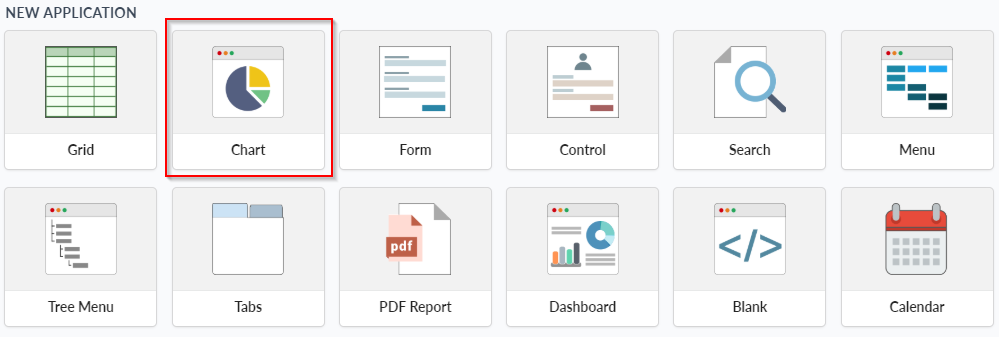
1- Create a new application of the type Chart by using the table “orders” .

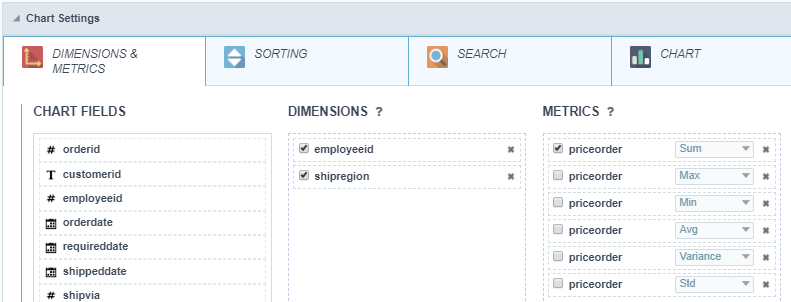
2- Select the required fields for dimension and metric. (For stacked chart, you must select 2 dimensions)

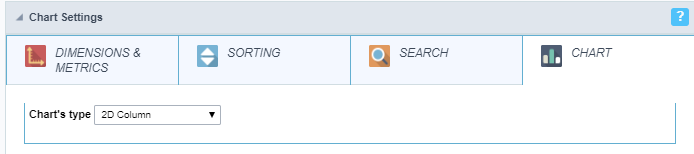
3- Go to the Chart tab, and then select the type “2D Column”.

4- Still in the Chart tab, go to the option “Bars – Stacking” and enable to display the “Percentage”.

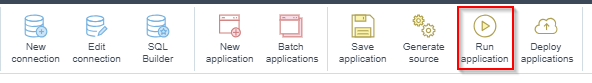
5- Just run the application

Tutorials in the same category

Tutorial: Overlapping Chart

In this sample, we’ll see how to create a chart using the resource of Overlapping. 1 – Cr...

Tutorial: Chart with scroll

In this sample we’ll see how to create a chart using the scroll resource. 1 – Create a ch...

Tutorial: Zoom line Chart

In this sample we’ll see how to create one analytic chart in lines using a zoom resource in one de...

Chart / Trend Zone

To place a trend line within our charts, the following steps must be performed: 1 -...

Comment this post